Kontakt
 Jak kupować
Dostawa
Doradca ds. zakupów
 Angielski
 36 b
36 b
Klienci kupili także


 /
/
 Miękka
 170.78
zł
170.78
zł


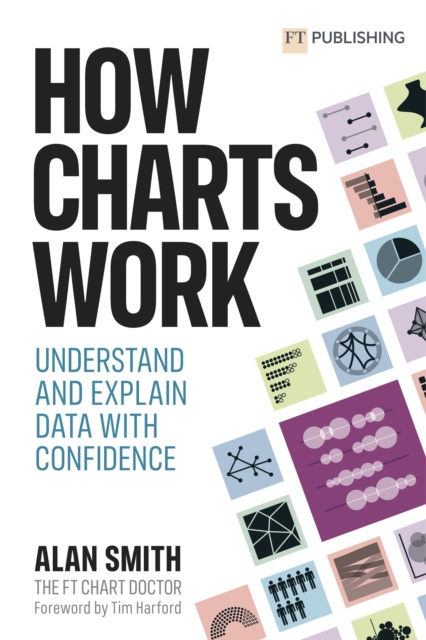
How Charts Work brings the secrets of effective data visualisation in a way that will help you bring data alive. Charts, graphs and tables are essential devices in business, but all too often they present information poorly. This book will help you: Feel confident understanding different types of charts, graphs and tables - and how to read them Recognise the true story behind the data presented and what the information really shows Know the principles and rules of how best to represent information so you can create your own information-driven (and beautiful) visuals Design visuals that people engage with, understand and act upon Don't value design over information - present data persuasively. Find the FT Chart Doctor's columns here - https://www.ft.com/chart-doctor


Informacje o książce
Angielski

Podaruj tę książkę jeszcze dziś
To łatwe
1 Dodaj książkę do koszyka i wybierz „dostarczyć jako prezent” 2 W odpowiedzi wyślemy Ci bon 3 Książka dotrze na adres obdarowanegoMogłoby Cię także zainteresować


 /
/
 Adobe ePub DRM
145.52
zł
Adobe ePub DRM
145.52
zł


 /
Twarda
96.71
zł
/
Twarda
96.71
zł


 /
Miękka
99.32
zł
/
Miękka
99.32
zł

 /
Twarda
203.25
zł
/
Twarda
203.25
zł


 /
Miękka
119.66
zł
/
Miękka
119.66
zł