Kod: 08021351
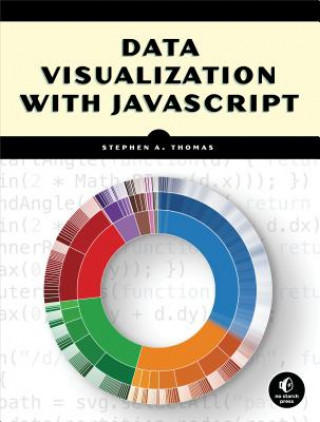
Data Visualization With Javascript
Autor Stephen Thomas
A well-designed data visualization makes information clear and captivating. Using color, animation, and interactive features, these graphics can make data come alive. Data Visualization with JavaScript shows you how to use a wide ... więcej
- Język:
 Angielski
 - Oprawa: Miękka
- Liczba stron: 384
Wydawca: No Starch Press,US, 2015
- Więcej informacji o książce

202.67 zł
Dostępność:
50 % szansa Otrzymaliśmy informację, że książka może być ponownie dostępna. Na podstawie państwa zamówienia, postaramy się książkę sprowadzić w terminie do 6 tygodni. Gwarancja pełnego zwrotu pieniędzy, jeśli książka nie zostanie zabezpieczona.
Przeszukamy cały świat
Zobacz książki o podobnej tematyce
-

Iron Kingdom
87.89 zł -14 % -

Six of Crows: Collector's Edition
95.44 zł -12 % -

Struggle: The Art Of Szukalski
165.22 zł -5 % -

All Shall Be Well
45.50 zł -

Five Minutes Answer to Paine's Letter to Genl. Washington.
73.73 zł -5 % -

Mystery of M. Felix. a Novel.
116.20 zł -5 % -

Proposals for Printing a Very Curious Discourse, in Two Volumes in Quarto, Intitled Pseudologia Politike
75.36 zł
Podaruj tę książkę jeszcze dziś
- Zamów książkę i wybierz "Wyślij jako prezent".
- Natychmiast wyślemy Ci bon podarunkowy, który możesz przekazać adresatowi prezentu.
- Książka zostanie wysłana do adresata, a Ty o nic nie musisz się martwić.
Powiadomienie o dostępności
Wpisz swój adres e-mail, aby otrzymać od nas powiadomienie,
gdy książka będzie dostępna. Proste, prawda?
Więcej informacji o Data Visualization With Javascript
Za ten zakup dostaniesz 118 punkty
 Opis
Opis
A well-designed data visualization makes information clear and captivating. Using color, animation, and interactive features, these graphics can make data come alive. Data Visualization with JavaScript shows you how to use a wide range of JavaScript tools and libraries to make effective data visualizations. In Data Visualization with JavaScript, author Stephen A. Thomas takes you through all the design principles and programming techniques you need to start building your own data visualizations for your website-from the basic line chart to fully interactive network graphs and animated maps. Thomas provides full color, step-by-step instructions for creating specialized web graphics, such as charts that display stock market details in response to mouse movements, and a map that animates train routes to show the fastest option. Inside you'll also learn how to: Make charts that respond to user actions like mouse movements, clicks, zooming, and scrolling. Use an AJAX service to dynamically retrieve data for a chart Choose the right kind of visualization for a particular data set, and integrate the graphic into your website Pick the right tool for your visualization, from easy-to-use web components with everything built in, to powerful, highly customizable libraries like D3.js Manage large data sets in the web browser using Underscore.js Integrate data visualizations into a full web application No matter what your experience level as a web developer, Data Visualization with JavaScript will have you building beautiful and effective data visualizations in no time.
 Szczegóły książki
Kategoria Książki po angielsku Computing & information technology Computer programming / software development Web programming
202.67 zł
- Pełny tytuł: Data Visualization With Javascript
- Autor: Stephen Thomas
- Język:
 Angielski
 - Oprawa: Miękka
- Liczba stron: 384
- EAN: 9781593276058
- ISBN: 1593276052
- ID: 08021351
- Wydawca: No Starch Press,US
- Waga: 866 g
- Wymiary: 180 × 238 × 32 mm
- Data wydania: 15. March 2015
Ulubione w innej kategorii
-

Java Concurrency in Practice
245.56 zł -4 % -

Effective Java
198.04 zł -5 % -

Microservice Patterns
198.04 zł -5 % -

Building Microservices
325.51 zł -5 % -

Fluent Python
325.51 zł -5 % -

Monolith to Microservices
223.71 zł -11 % -

Modern Java in Action
251.50 zł -5 % -

Serious Python
130.38 zł -15 % -

CSS Secrets
182.53 zł -11 % -

Optimizing Java
347.26 zł -

Murachs Java Servlets & JSP
227.04 zł -5 % -

Vue.js - Up and Running
209.02 zł -

Struts: The Complete Reference
213.45 zł -4 % -

Functional Web Development with Elixir, OTP and Phoenix
230.56 zł -

JBoss - A Developer's Notebook
140.15 zł -5 % -

Just Spring Data Access
104.10 zł -

Eloquent Javascript, 3rd Edition
148.10 zł -14 % -

Learning Python
294.90 zł -10 % -

Programming Python
294.90 zł -10 % -

HTML & CSS: Design and Build Websites
121.12 zł -4 % -

JavaScript and JQuery - Interactive Front-End Web Development
159.58 zł -5 % -

Java Persistence with Hibernate
246.37 zł -1 % -

Beyond The Basic Stuff With Python
130.38 zł -15 % -

Head First Python 2e
235.80 zł -6 % -

REST API Design Rulebook
128.47 zł -

Architecture Patterns with Python
261.27 zł -11 % -

Java Performance
269.43 zł -5 % -

Pro Angular
285.33 zł -5 % -

RESTful Web APIs
193.01 zł -

PHP, MySQL, & JavaScript All-In-One For Dummies
155.95 zł -30 % -

OCA - Oracle Certified Associate Java SE 8 er I Study Guide: Exam 1Z0-808
238.82 zł -11 % -

Effective TypeScript
186.36 zł -10 % -

JavaScript : The Good Parts
125.55 zł -4 % -

Spring Boot in Action
121.12 zł -20 % -

Python Pocket Reference
105.71 zł -4 % -

Programming TypeScript
223.71 zł -11 % -

Deep Learning with Python
276.98 zł -

Effective Python
205.59 zł -4 % -

Fullstack React
335.98 zł -

OCA / OCP Java SE 8 Programmer Practice Tests
167.33 zł -4 % -

Impractical Python Projects
125.44 zł -4 % -

Camel in Action, Second Edition
375.55 zł -

Node.js Design Patterns -
262.88 zł -

Kotlin Design Patterns and Best Practices
224.62 zł -

Python Playground
126.25 zł -11 % -

Numerical Python
285.54 zł -5 % -

Spring Boot: Up and Running
261.27 zł -11 % -

Introducing Python
229.56 zł -4 % -

Practical JIRA Administration
104.10 zł
zadowolonych klientów
Od roku 2008 obsłużyliśmy wielu miłośników książek, ale dla nas każdy był tym wyjątkowym.
Copyright! ©2008-24 libristo.pl Wszelkie prawa zastrzeżonePrywatnieCookies


 21 milionów książek
 Dostawa 10.99 zł
 (32) 444 93 66 (8-15.30h)