Kod: 11613158
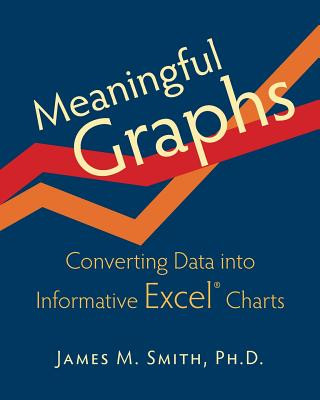
Meaningful Graphs
Autor James M. Smith
Meaningful Graphs is a concise and practical go-to guide for creating charts in Excel ® that clearly and accurately tell the story in your data. It incorporates (a) explanations of the graph design principles of the experts (Tuft ... więcej
- Język:
 Angielski
 - Oprawa: Miękka
- Liczba stron: 228
Wydawca: James M. Smith, 2014
- Więcej informacji o książce

Zobacz książki o podobnej tematyce
-

Truth and Beauty
104.93 zł -12 % -

Heart Monitor Training for the Compleat Idiot
92.63 zł -

Always by My Side: The Healing Gift of a Father's Love
66.12 zł -11 % -

It All Began in Monte Carlo
275.40 zł -

Eighty-Eight Keys
62.39 zł -

My Religion
153.72 zł -

A Doubter's Almanac
149.29 zł
Podaruj tę książkę jeszcze dziś
- Zamów książkę i wybierz "Wyślij jako prezent".
- Natychmiast wyślemy Ci bon podarunkowy, który możesz przekazać adresatowi prezentu.
- Książka zostanie wysłana do adresata, a Ty o nic nie musisz się martwić.
Więcej informacji o Meaningful Graphs
Za ten zakup dostaniesz 72 punkty
 Opis
Opis
Meaningful Graphs is a concise and practical go-to guide for creating charts in Excel ® that clearly and accurately tell the story in your data. It incorporates (a) explanations of the graph design principles of the experts (Tufte, Few, Robbins, Zelazny, and others), (b) the software steps necessary to incorporate these principles into Excel ® charts, and (c) chart-related discussions of quality improvement (including Pareto charts), statistics (including run charts and correlations), and the use of graphs in PowerPoint ® presentations (including chart animation). Also included are numerous "Tips" and "In Practice" examples drawn from over 35 years of working with data in healthcare settings. Coverage begins with highlighting the importance of knowing the story in your data and general principles of chart design (e.g., chartjunk, the use of color, consideration of three dimensional charts) and then proceeds to examine and create the five major chart types (column, bar, line, pie, scatter). This is followed by considerations of the pros and cons of each of the six less frequently employed chart types. There are over 120 graphs in full color plus tables and illustrations. Discussions of the most useful chart types include examples with accompanying data to facilitate practice. While illustrations are especially tailored for healthcare professionals (physicians, nurses, patient safety, quality improvement staff, executives, and managers) both in their work setting and in their academic preparation, the principles of graph design and the Excel ® techniques required to incorporate these principles apply equally well in other settings. The latter include other industries and academic programs, including those leading to degrees in business administration (MBA), public health (MPH), and public administration (MPA). If you follow the advice in this book, the graphs you create for reports, presentations, posters, or publications will be more informative and more easily understood.
 Szczegóły książki
Kategoria Książki po angielsku Computing & information technology Business applications Spreadsheet software
122.98 zł
- Pełny tytuł: Meaningful Graphs
- Podtytuł: Converting Data Into Informative Excel Charts
- Autor: James M. Smith
- Język:
 Angielski
 - Oprawa: Miękka
- Liczba stron: 228
- EAN: 9780986054907
- ISBN: 0986054909
- ID: 11613158
- Wydawca: James M. Smith
- Waga: 458 g
- Wymiary: 254 × 203 × 12 mm
- Data wydania: 01. June 2014
Ulubione w innej kategorii
-

Microsoft Excel 2019 VBA and Macros
111.69 zł -38 % -

Master Your Data with Excel and Power BI
143.44 zł -7 % -

Excel 2019 All-in-One For Dummies
156.14 zł -10 % -

Excel 2016 Power Programming with VBA
212.29 zł -11 % -

Analyzing Data with Power BI and Power Pivot for Excel
147.37 zł -5 % -

Excel 2019 Bible
212.29 zł -11 % -

Exam Ref 70-778 Analyzing and Visualizing Data by Using Microsoft Power BI
154.23 zł -14 % -

Excel 2016 Bible
212.29 zł -11 % -

Excel 2013 Power Programming with VBA
193.74 zł -10 % -

Collect, Combine, and Transform Data Using Power Query in Excel and Power BI
165.82 zł -4 % -

Absolute Guide to Dashboarding and Reporting with Power BI
123.88 zł -6 % -

Control + Shift + Enter
123.88 zł -6 % -

Excel 2019 Power Programming with VBA
212.29 zł -11 % -

MOS 2016 Study Guide for Microsoft Excel Expert
95.86 zł -14 % -

Microsoft Excel 2019 Data Analysis and Business Modeling
205.64 zł -4 % -

Exam Ref 70-779 Analyzing and Visualizing Data with Microsoft Excel
218.34 zł -

Microsoft Power BI Dashboards Step by Step
151.50 zł -5 % -

Excel 2019 For Dummies
89.31 zł -30 % -

Data Analysis Using SQL and Excel, 2e
241.52 zł -

Excel 2016 Formulas
225.19 zł -5 % -

Definitive Guide to Excel VBA
217.33 zł -5 % -

Microsoft Excel 2013 Building Data Models with PowerPivot
151.71 zł -15 % -

Excel 2010 Bible
174.89 zł -11 % -

Writing Excel Macros with VBA 2e
156.14 zł -10 % -

Excel Sales Forecasting For Dummies, 2e
128.82 zł -4 % -

Microsoft Excel 2019 Pivot Table Data Crunching
154.23 zł -14 % -

Excel 2013 Bible
193.74 zł -10 % -

Advanced Excel
175.90 zł -

Programming Excel with VBA
398.18 zł -7 % -

PowerPivot for Business Intelligence Using Excel and SharePoint
237.79 zł -

Excel VBA in easy steps
62.89 zł -14 % -

Microsoft Excel 2016 Step by Step
133.86 zł -15 % -

Statistics for the Utterly Confused
157.05 zł -2 % -

Excel 2010 Formulas
193.74 zł -10 % -

Microsoft Excel 2013 Step By Step
133.86 zł -15 % -

Microsoft Excel Data Analysis and Business Modeling
189.61 zł -15 % -

Excel Hacks 2e
118.74 zł -10 % -

Ctrl+Shift+Enter
202.31 zł -

VBA and Macros for Microsoft Office Excel 2007
261.08 zł -

Dashboarding and Reporting with Power Pivot and Excel
123.88 zł -6 % -

Brilliant Excel VBA Programming
103.42 zł -14 % -

Dashboards for Excel
518.24 zł -

Guerrilla Data Analysis Using Microsoft Excel
104.12 zł -7 % -

Microsoft Business Intelligence Tools for Excel Analysts
193.74 zł -10 % -

High Performance Lotus Cortina Mk.2 Workshop Manual
273.48 zł -

Excel 2010 for Engineering Statistics
296.97 zł -

Teach Yourself VISUALLY Excel 2016
118.74 zł -10 % -

Slaying Excel Dragons
123.88 zł -6 % -

Financial Modelling and Asset Valuation with Excel
539.61 zł
zadowolonych klientów
Od roku 2008 obsłużyliśmy wielu miłośników książek, ale dla nas każdy był tym wyjątkowym.
Copyright! ©2008-24 libristo.pl Wszelkie prawa zastrzeżonePrywatnieCookies


 21 milionów książek
 Dostawa 10.99 zł
 (32) 444 93 66 (8-15.30h)