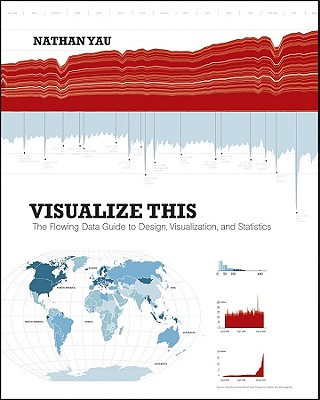
Code: 04376323
Visualize This - The FlowingData Guide to Design, Visualization and Statistics
by Nathan Yau
Practical data design tips from a data visualization expert of the modern age Data doesn't decrease; it is ever-increasing and can be overwhelming to organize in a way that makes sense to its intended audience. Wouldn't it be won ... more
- Language:
 English
 - Binding: Paperback
- Number of pages: 384
Publisher: John Wiley & Sons Inc, 2011
- More about this

163.81 zł
RRP: 184.11 zł
You save 20.31 zł

Low in stock at our supplier
Shipping in 10 - 14 days
Potřebujete více kusů?Máte-li zájem o více kusů, prověřte, prosím, nejprve dostupnost titulu na naši zákaznické podpoře.
Add to wishlist
You might also like
-

Gravity Falls Journal 3
89.40 zł -

Little Women
12.17 zł -28 % -

The Life of a Stupid Man
20.73 zł -

God of Wrath
119.10 zł -

Archer's Voice
64.63 zł -15 % -

100 Deadly Skills
77.22 zł -14 % -

Rebecca
47.31 zł -23 % -

Tender Is the Flesh
77.52 zł -5 % -

Visual Thinking
88.69 zł -23 % -

Hekate
80.94 zł -7 % -

English Grammar in Use 5th edition
120.31 zł -

Influence, New and Expanded UK
88.69 zł -23 % -

The Very Hungry Caterpillar
32.71 zł -26 % -

The Art of Japanese Joinery
113.36 zł -5 % -

Oracle of the Radiant Sun: Astrology Cards to Illuminate Your Life
125.55 zł -5 % -

The Star Tarot
145.48 zł -5 % -

Midnight Sun
37.75 zł -26 % -

Titan
88.69 zł -23 % -

52 Weeks of Scarves
88.69 zł -23 % -

Rebuilding Milo
276.07 zł -11 % -

Wisdom of the Oracle Divination Cards
96.25 zł -9 %
Give this book as a present today
- Order book and choose Gift Order.
- We will send you book gift voucher at once. You can give it out to anyone.
- Book will be send to donee, nothing more to care about.
More about Visualize This - The FlowingData Guide to Design, Visualization and Statistics
You get 95 loyalty points
 Book synopsis
Practical data design tips from a data visualization expert of the modern age Data doesn't decrease; it is ever-increasing and can be overwhelming to organize in a way that makes sense to its intended audience. Wouldn't it be wonderful if we could actually visualize data in such a way that we could maximize its potential and tell a story in a clear, concise manner? Thanks to the creative genius of Nathan Yau, we can. With this full-color book, data visualization guru and author Nathan Yau uses step-by-step tutorials to show you how to visualize and tell stories with data. He explains how to gather, parse, and format data and then design high quality graphics that help you explore and present patterns, outliers, and relationships. Presents a unique approach to visualizing and telling stories with data, from a data visualization expert and the creator of flowingdata.com, Nathan Yau Offers step-by-step tutorials and practical design tips for creating statistical graphics, geographical maps, and information design to find meaning in the numbers Details tools that can be used to visualize data-native graphics for the Web, such as ActionScript, Flash libraries, PHP, and JavaScript and tools to design graphics for print, such as R and Illustrator Contains numerous examples and descriptions of patterns and outliers and explains how to show them Visualize This demonstrates how to explain data visually so that you can present your information in a way that is easy to understand and appealing.
 Book details
Book category Books in English Computing & information technology Computer science Artificial intelligence
163.81 zł
- Full title: Visualize This - The FlowingData Guide to Design, Visualization and Statistics
- Author: Nathan Yau
- Language:
 English
 - Binding: Paperback
- Number of pages: 384
- EAN: 9780470944882
- ISBN: 0470944889
- ID: 04376323
- Publisher: John Wiley & Sons Inc
- Weight: 764 g
- Dimensions: 232 × 188 × 19 mm
- Date of publishing: 30. June 2011
Trending among others
-

Introducing MLOps
261.27 zł -11 % -

Algorithms for Image Processing and Computer Vision
490.73 zł -

Dive into Deep Learning
154.95 zł -

Python Machine Learning
273.15 zł -

Machine Learning Design Patterns
261.27 zł -11 % -

Deep Learning
73.39 zł -5 % -

Probabilistic Machine Learning
691.81 zł -

AI and Machine Learning For Coders
269.53 zł -5 % -

Perceptrons
336.08 zł -

Neural Networks and Deep Learning
331.35 zł -7 % -

Heuristic Search
499.80 zł -

Maschinelles Lernen - Grundlagen und Anwendungen
181.73 zł -

Real-Time C++
285.64 zł -

Artificial Intelligence
321.58 zł -

Deep Learning
468.89 zł -

Advances in Financial Machine Learning
219.99 zł -11 % -

On Intelligence
85.57 zł -5 % -

Pattern Recognition and Machine Learning
451.97 zł -

Artificial Intelligence Basics
185.45 zł -5 % -

Pattern Recognition and Machine Learning
533.43 zł -

Creativity Code
37.75 zł -26 % -

Python Machine Learning -
219.59 zł -

Practical MLOps
351.08 zł -11 % -

Why Greatness Cannot Be Planned
137.63 zł -4 % -

Words and Rules
85.27 zł -10 % -

Advanced API Security
185.45 zł -5 % -

Dancing with Qubits
262.88 zł -

Probabilistic Graphical Models
590.21 zł -12 % -

Superminds
51.84 zł -23 % -

Virtual and Augmented Reality for Automobile Industry: Innovation Vision and Applications
1020.04 zł -

Deep Learning
360.14 zł -

Neural Networks and Deep Learning
296.81 zł -

Computer Vision
270.94 zł -

Programming Machine Learning
191.09 zł -7 % -

Deep Learning and the Game of Go
251.50 zł -5 % -

AI for Games Developers
159.17 zł -5 % -

Artificial Intelligence with Common LISP
493.25 zł -

Artificial Intelligence: A Modern Approach, Global Edition
330.14 zł -

Book of Why
52.35 zł -15 % -

Reinforcement Learning
468.89 zł -

Dialogue and Instruction, 1
285.64 zł -

Hands-On Machine Learning with Scikit-Learn and TensorFlow
214.25 zł -

We have been harmonised
47.31 zł -23 % -

Machine Learning
527.08 zł -12 % -

Learning OpenCV 3
420.15 zł -

Practical Machine Learning with Python
412.50 zł -

Understanding Machine Learning
325.61 zł -

Natural Language Processing in Action
270.74 zł -

Deep Learning for Natural Language Processing
286.24 zł
safisfied customers
Since 2008, we have served long line of book lovers, but each of them was always on the first place.
Copyright! ©2008-24 libristo.pl All rights reservedPrivacyPoučení o cookies


 21 million books
 Delivery 12.99 zł
 (32) 444 93 66 (8-15.30h)