Kod: 09269140
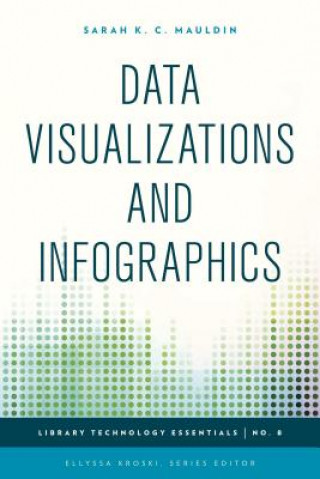
Data Visualizations and Infographics
Autor Sarah K. C. Mauldin
Graphics which visually represent data or complex ideas are oftentimes easier for people to understand and digest than standalone statistics. A map shaded with different colors to represent religious affiliations or income levels ... więcej
- Język:
 Angielski
 - Oprawa: Miękka
- Liczba stron: 134
Wydawca: Rowman & Littlefield, 2015
- Więcej informacji o książce

Zobacz książki o podobnej tematyce
-
Wall Street Journal Guide to Information Graphics
101.94 zł -8 % -

Truthful Art, The
182.15 zł -9 % -

Tissue Cleansing Through Bowel Management
70.97 zł -9 % -

Orthodox Christianity Reasonable Faith
70.05 zł -

Elements of Information Organization and Dissemination
572.37 zł -

Role of Information Professionals in the Knowledge Economy
344.21 zł -4 % -

Information Graphics
485.86 zł -

GIS for Planning and the Built Environment
1000.16 zł -

Master the Wards: Internal Medicine Handbook, Third Edition
273.95 zł -

Graphic Design
437.12 zł -

Human Ear
47.71 zł -23 % -
Data Visualization
539.67 zł -5 % -

Digital Curation Projects Made Easy
239.62 zł -

Classification and Data Mining
471.74 zł -2 %
Podaruj tę książkę jeszcze dziś
- Zamów książkę i wybierz "Wyślij jako prezent".
- Natychmiast wyślemy Ci bon podarunkowy, który możesz przekazać adresatowi prezentu.
- Książka zostanie wysłana do adresata, a Ty o nic nie musisz się martwić.
Więcej informacji o Data Visualizations and Infographics
Za ten zakup dostaniesz 197 punkty
 Opis
Opis
Graphics which visually represent data or complex ideas are oftentimes easier for people to understand and digest than standalone statistics. A map shaded with different colors to represent religious affiliations or income levels enables researchers to quickly identify trends and patterns. New free tools and applications offer librarians the opportunity to organize and manipulate data to quickly create these helpful graphics. Learn how to overlay data sets on maps, create infographics for library services and instruction, use mindmapping for group brainstorming sessions, produce detailed timelines, process flowcharts, diagrams, and much more in this complete how-to-guidebook. This complete how-to guidebook provides you with the tools and inspiration you need to use infographics and data visualization techniques in your library to knock your audience's socks off as you tell your story in a visual format that can be consumed and understood at a glance. Readers will learn how to implement projects such as: *Use the Tools You Already Have to Create a Simple Infographic *Using Microsoft Word *Creating a Library Services Infographic Using Piktochart *Creating Instructional Infographics with Easel.ly *Creating an Interactive Historical Timeline Two Ways *Mindmapping Your Brainstorming Meetings *Creating Library Website Flowcharts and Diagrams Using Creately *Creating Interactive Maps with Imported Data *Creating Complex Data Visualizations
 Szczegóły książki
Kategoria Książki po angielsku Reference, information & interdisciplinary subjects Library & information sciences Library & information services
341.06 zł
- Pełny tytuł: Data Visualizations and Infographics
- Autor: Sarah K. C. Mauldin
- Język:
 Angielski
 - Oprawa: Miękka
- Liczba stron: 134
- EAN: 9781442243873
- ISBN: 1442243872
- ID: 09269140
- Wydawca: Rowman & Littlefield
- Waga: 214 g
- Wymiary: 230 × 152 × 16 mm
- Data wydania: 15. August 2015
Ulubione w innej kategorii
-

Strategic Planning for Academic Libraries
286.84 zł -

Mentoring A-Z
335.48 zł -

New Bodleian - Making the Weston Library
167.53 zł -9 % -

Innovation in Public Libraries
453.87 zł -

Trinity College Library Dublin
167.12 zł -15 % -

Post-Pandemic Library Handbook
247.44 zł -

Expert Internet Searching
435.19 zł -

Emerging Library Technologies
453.87 zł -

Serving Those Who Served
346.75 zł -

End of Wisdom?
299.03 zł -

Mentoring and Managing Students in the Academic Library
318.52 zł -

Exhibits and Displays
397.62 zł -

Innovative School Librarian
452.45 zł -

Media and Information Literacy in Higher Education
453.87 zł -

Makerspaces in Libraries
341.06 zł -

Distributed Learning
572.57 zł -

Museum Librarianship
318.52 zł -

Promise of Cultural Institutions
307.35 zł -

Young Adult Literature
346.75 zł -

Marketing for Special and Academic Libraries
555.62 zł -

Picture Books for Children
290.39 zł -

Digital Paper
130.27 zł -

Collecting Shakespeare
188.25 zł -

Infographics
482.41 zł -

Google and the Digital Divide
332.74 zł -

Partnerships and New Roles in the 21st-Century Academic Library
668.63 zł -

Organizing Exhibitions
487.08 zł -

Google Scholar and More
284 zł -

Role of the Electronic Resources Librarian
459.46 zł -

Facelifts for Special Libraries
261.66 zł -9 % -

Improving Student Information Search
290.50 zł -9 % -

Fee-Based Services in Library and Information Centres
175.45 zł -

Developing Digital Scholarship
417.93 zł -

Strong Future for Public Library Use and Employment
499.06 zł -

Systematic Searching
504.44 zł -

Innovations in Science and Technology Libraries
863.49 zł -

University Libraries and Digital Learning Environments
218.91 zł -

Organizing Exhibitions
971.93 zł -

Scholarly Communication in Science and Engineering Research in Higher Education
863.49 zł -

Basic Reference Sources
470.32 zł -

Forecasting the Future
507.49 zł -

Music, Culture, and the Library
693.20 zł -

Romance of Libraries
284.61 zł -

Social Informatics: An Information Society for All? In Remembrance of Rob Kling
881.46 zł -

Bulletin Bored? or Bulletin Boards!
507.49 zł -

Last One Out Turn Off the Lights
507.49 zł -

Healthcare Knowledge Management
881.46 zł -

Development of Creative Spaces in Academic Libraries
362.18 zł -4 % -

Laying the Foundation
174.44 zł
zadowolonych klientów
Od roku 2008 obsłużyliśmy wielu miłośników książek, ale dla nas każdy był tym wyjątkowym.
Copyright! ©2008-24 libristo.pl Wszelkie prawa zastrzeżonePrywatnieCookies


 21 milionów książek
 Dostawa 10.99 zł
 (32) 444 93 66 (8-15.30h)